Automating Insights with Python + SQL
Transforming raw data into actionable business intelligence.
Featured Projects
.png)
End-to-End Healthcare Automated Data Pipeline
Completed: 2026-01-05
Engineered a Full-Stack Simulation: Built a secure PHP/MySQL web portal to replicate real-world constraints like role-based access and dynamic UI loading. Automated Data Extraction: Developed a Pyt ... Read More about End-to-End Healthcare Automated Data Pipeline
Keywords: Python, SQL, Playwright, Pandas, Excel, PHP, Web Scraping, ETL Pipeline, Data Engineering, Automation, Healthcare Analytics, Data Cleaning, Full Stack Integration
Technology: Python, SQL, PHP, Excel, Git
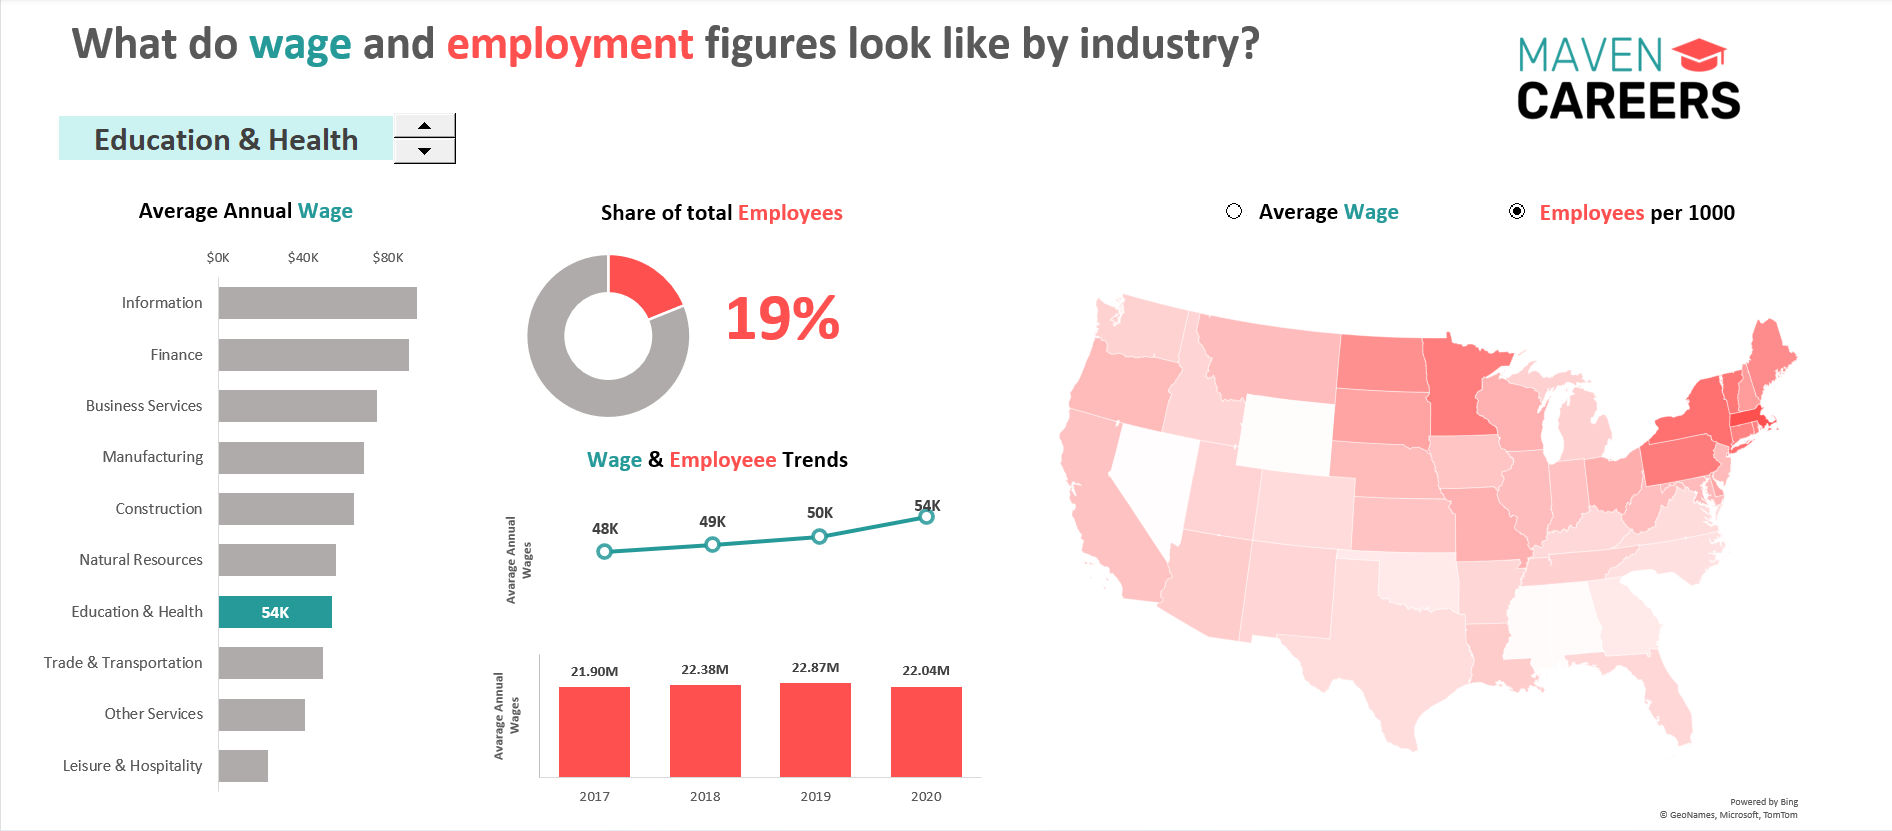
Maven Careers Career Path Dashboard
Completed: 2024-10-25
Created a dashboard to help high school seniors explore career paths by analyzing industry data. Visualized metrics like annual wages and employment pools across various industries. Designed for inter ... Read More about Maven Careers Career Path Dashboard
Keywords: Dashboard, Report, Analysis
Technology: Excel
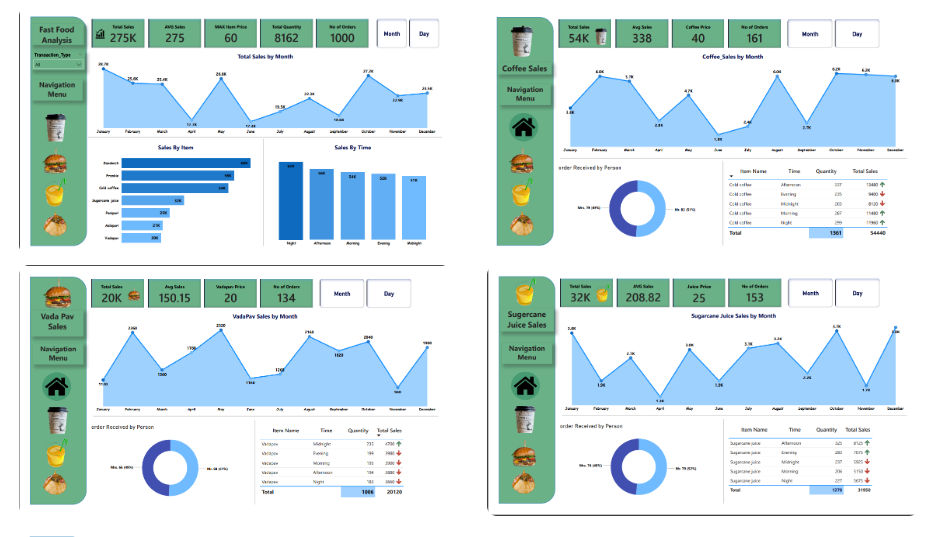
Fast Food Analysis Using Power BI
Completed: 2024-08-26
Created a comprehensive Power BI dashboard for fast food analysis, showcasing Total Sales, Avg Sales, Max Item Price, Total Quantity, and Number of Orders. Developed 5 interactive dashboards with deta ... Read More about Fast Food Analysis Using Power BI
Keywords: Report, Analysis, Data Analysis, Sales
Technology: Power BI
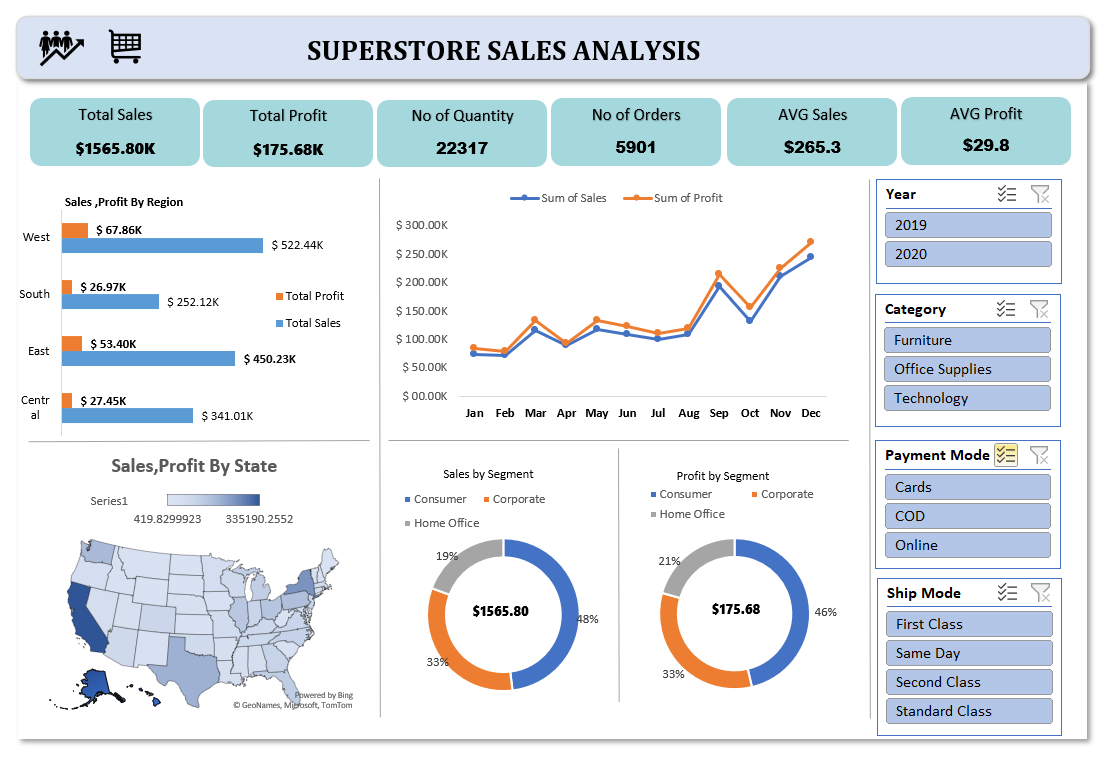
Comprehensive Superstore Sales Analysis in Excel
Completed: 2024-08-14
Created an interactive Excel dashboard to analyze superstore sales data, featuring KPIs like Total Sales, Total Profit, and Average Order Value. Implemented visualizations such as Donut Charts, Bar Ch ... Read More about Comprehensive Superstore Sales Analysis in Excel
Keywords: Excel,Visualization,Dashboards,KPI,Analysis
Technology: Excel
Retail Sales Data Analysis Using SQL
Completed: 2024-07-10
Conducted comprehensive retail sales data analysis using SQL. Extracted and transformed data to generate insights on regional, product, and customer segment performance Generated detailed SQL reports ... Read More about Retail Sales Data Analysis Using SQL
Keywords: Analysis, Data Analysis, PPT
Technology: SQL
Latest Projects
Fast Food Analysis Using Power BI
Completed: 2024-08-26
Created a comprehensive Power BI dashboard for fast food analysis, showcasing Total Sales, Avg Sales, Max Item Price, Total Quantity, and Number of Orders. Developed 5 interactive dashboards with deta ... Read More about Fast Food Analysis Using Power BI
Keywords: Report, Analysis, Data Analysis, Sales
Technology: Power BI
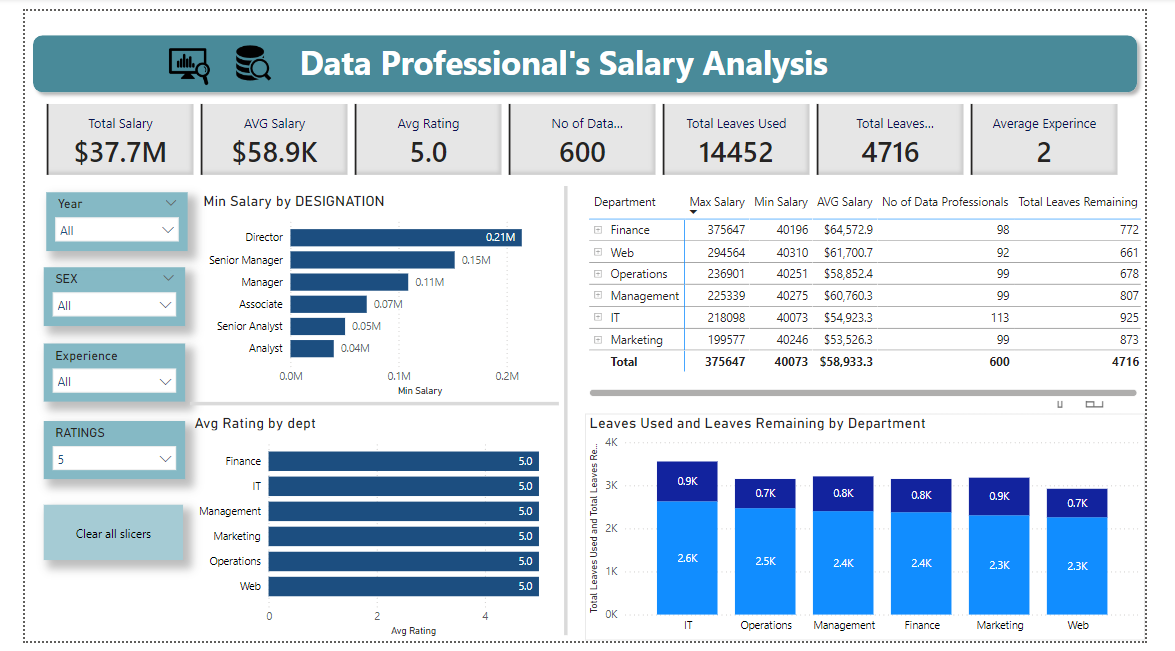
Data professional's salary dashboard Using Power BI
Completed: 2024-08-18
Keywords: Dashboard, Report, Analysis
Technology: Power BI
Comprehensive Superstore Sales Analysis in Excel
Completed: 2024-08-14
Created an interactive Excel dashboard to analyze superstore sales data, featuring KPIs like Total Sales, Total Profit, and Average Order Value. Implemented visualizations such as Donut Charts, Bar Ch ... Read More about Comprehensive Superstore Sales Analysis in Excel
Keywords: Excel,Visualization,Dashboards,KPI,Analysis
Technology: Excel
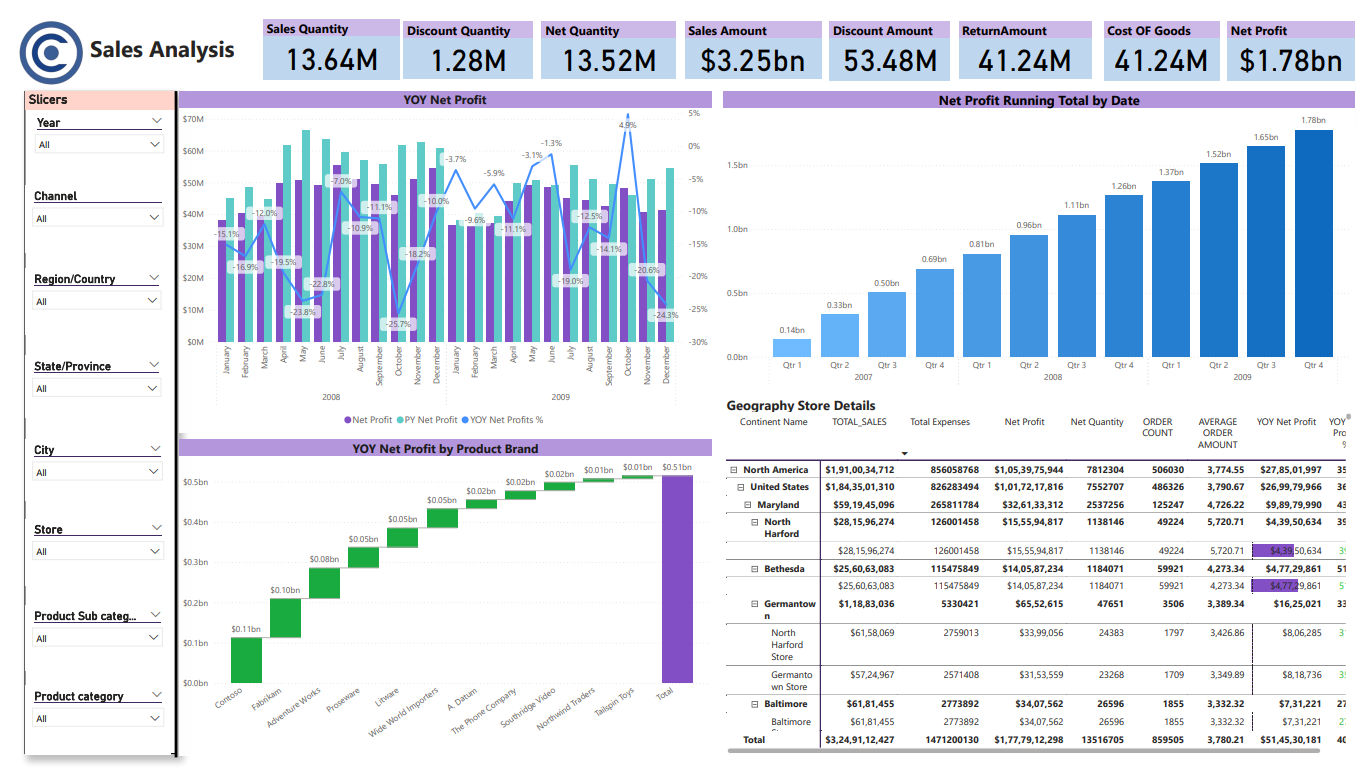
Contoso Sales Dashboard Using Power BI
Completed: 2024-08-07
Completed a guided project creating a comprehensive sales dashboard for Contoso using Power BI. Utilized advanced DAX formulas for in-depth analysis of YOY net profit and total sales quantity. Designe ... Read More about Contoso Sales Dashboard Using Power BI
Keywords: PowerBI, Data
Technology: Power BI
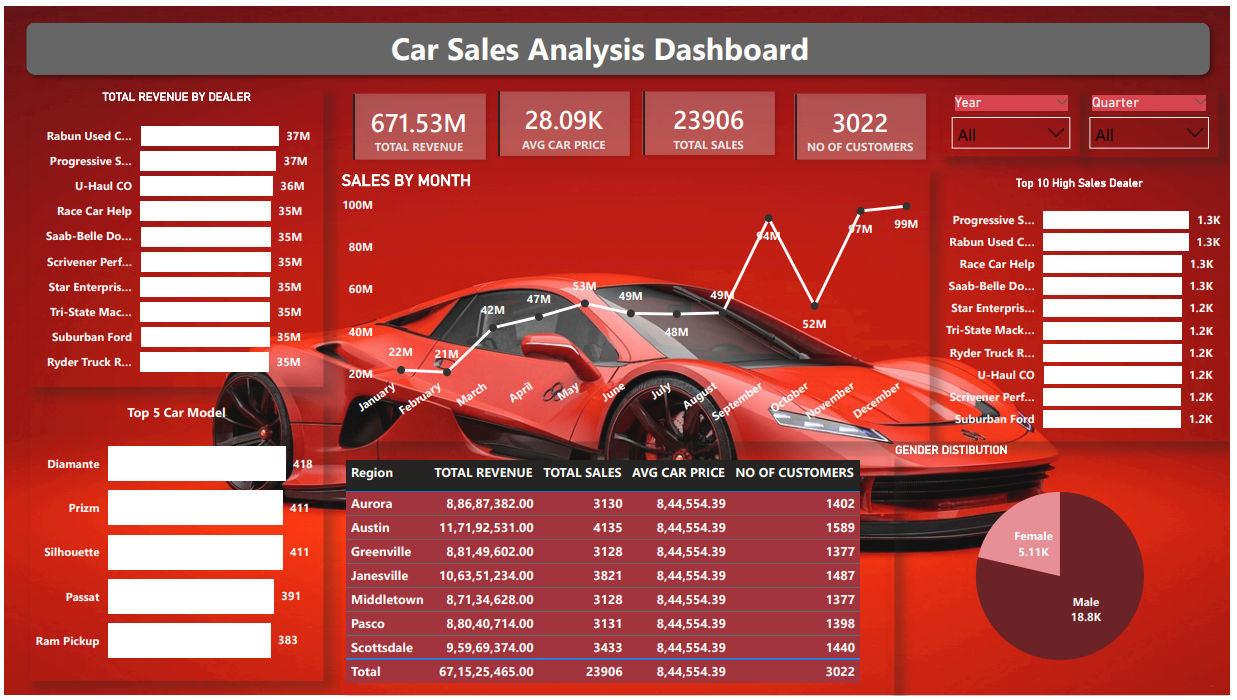
Car Sales Analysis Using Python , SQL, Power BI
Completed: 2024-08-02
Analyzed Amazon sales data with Python, focusing on performance and profitability. Developed insightful visuals with Power BI to highlight key trends and patterns. Leveraged group by operations extens ... Read More about Car Sales Analysis Using Python , SQL, Power BI
Keywords: Sales Analysis, Car Sales, Data Analysis
Technology: SQL, Python, Power BI
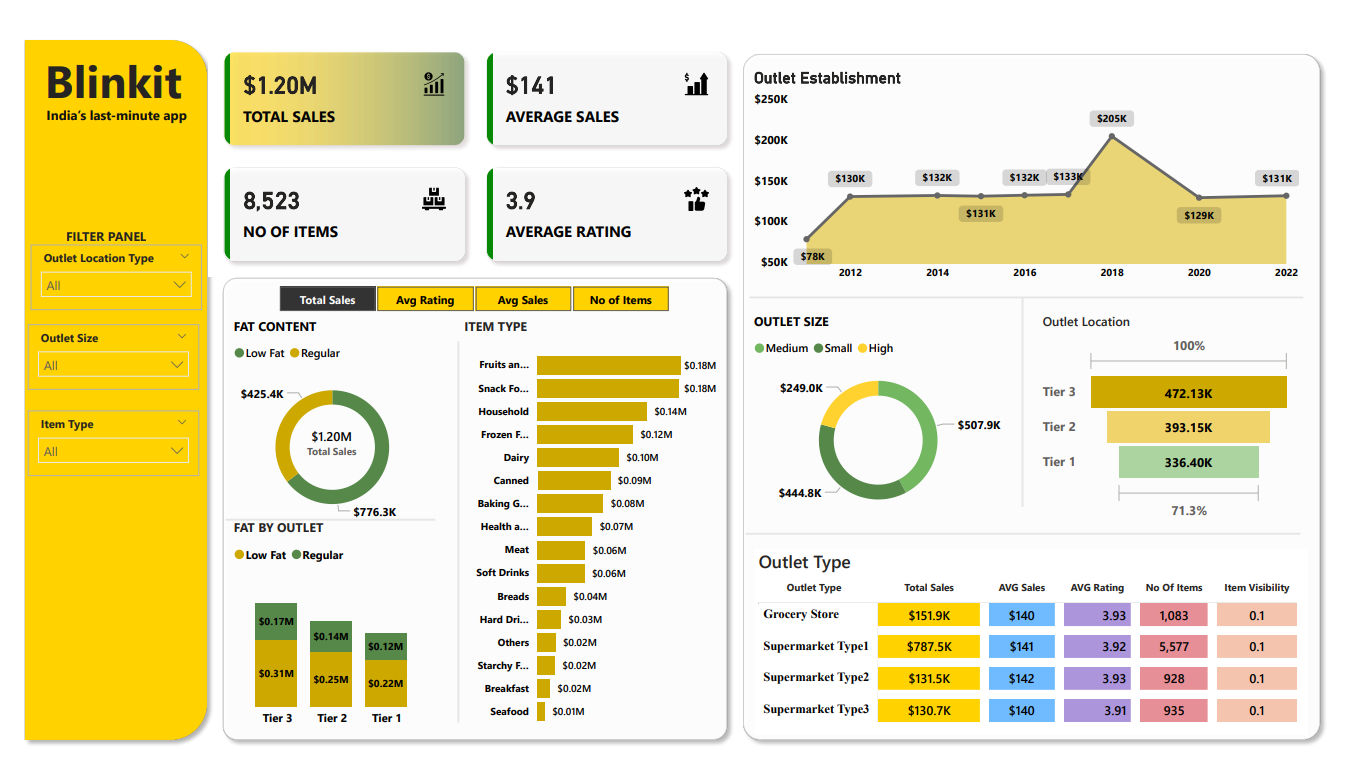
Comprehensive Sales Dashboard for Blinkit ,(Guided) Using Power BI
Completed: 2024-07-31
Developed an interactive Power BI dashboard to analyze Blinkit’s sales data . Created visualizations for sales performance, item metrics, and outlet statistics. Enhanced skills in data visualization a ... Read More about Comprehensive Sales Dashboard for Blinkit ,(Guided) Using Power BI
Keywords: PowerBI, Data Analysis
Technology: Power BI